If you add <XLS:CHART,Title=vpxPrint EXCEL example...>
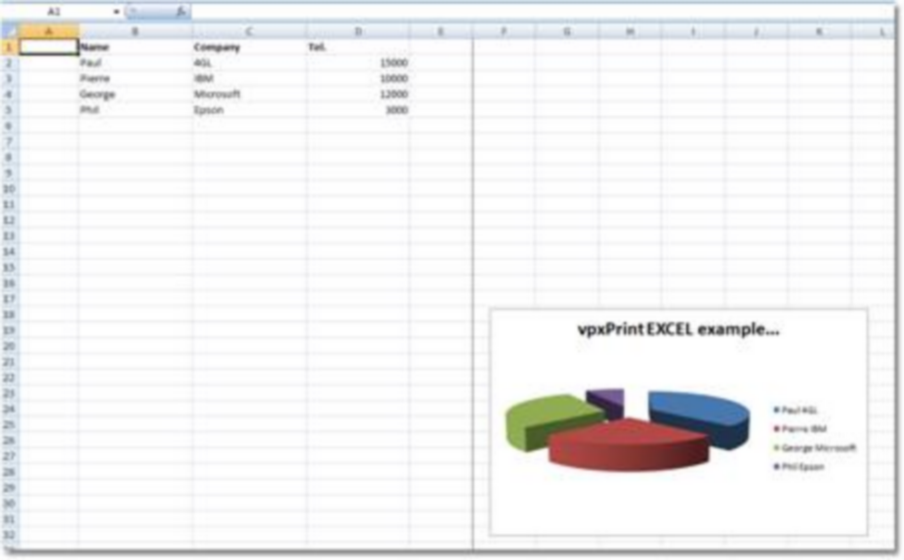
With the <XLS> tag, you can fully customize your chart: lines or columns color, font, justification or alignment.
Example:
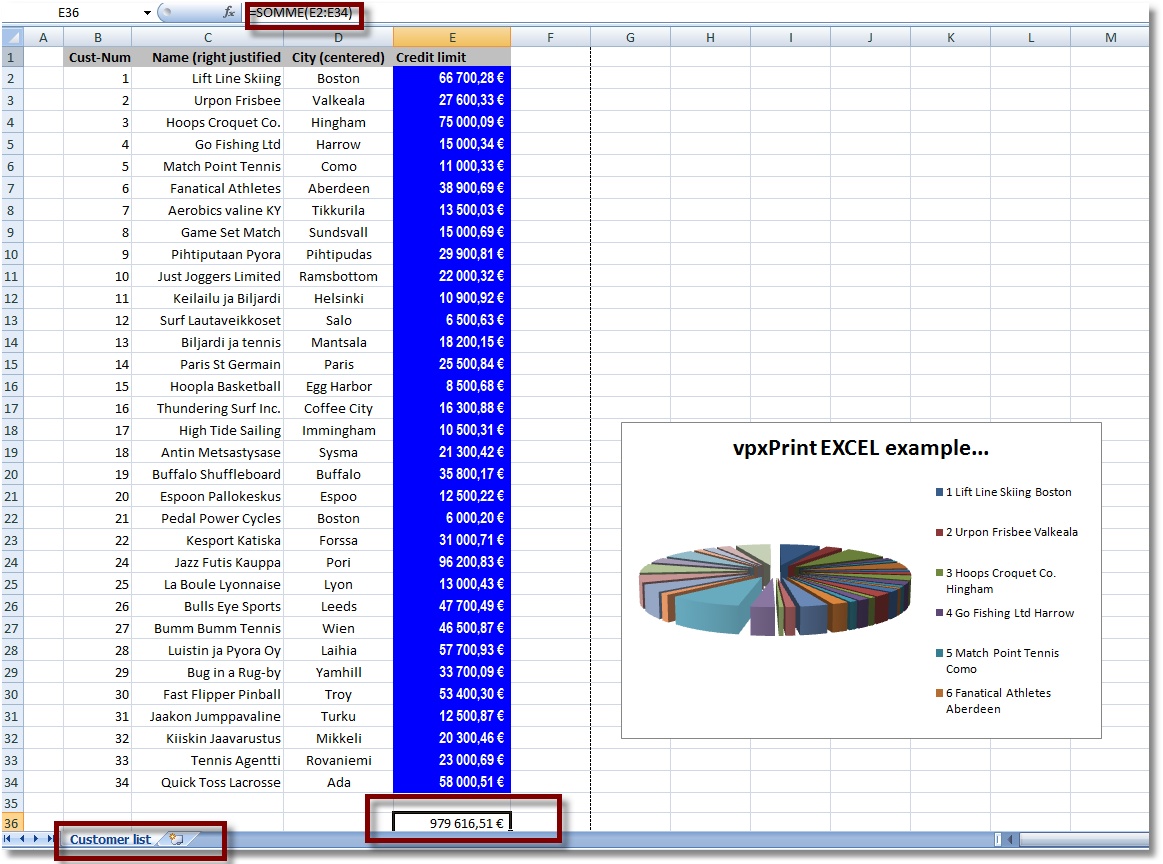
<XLS:CHART,SHEET=Customer list,Title=vpxPrint EXCEL example...> |
draw a chart, set a sheet name and a title to the excel document |
<XLS:SELECT=E2:E%9,FONT=Arial Narrow,size=11,bold, BGcolor=blue,FGcolor=white,style=Currency, SELECT=c:c,RIGHT,SELECT=D:D,center> |
select column E from row 2 to the last filled row (%9) set the background color to blue, the font color to white, currency style select the column C, applies 'right align', select the column D and center |
<XLS:SELECT=B%1:%Z1,bgcolor=ltgray> |
select from B first line (B%1) to last col row 1 (%Z1) |
<XLS:Y=%9, Y++,Y++, SELECT=%Z%Y, FORMULA==SUM(%Z2:%Z%9), LANDSCAPE,grid,fit,headerL=John Doe> |
assign Y = last row (%9) add 2 to Y select last col last row + 2 (%Z%Y) put a formula in this cell: sum(last col 2nd row %Z) to the last cell (%Z%9) set values for printing, Landscape... |
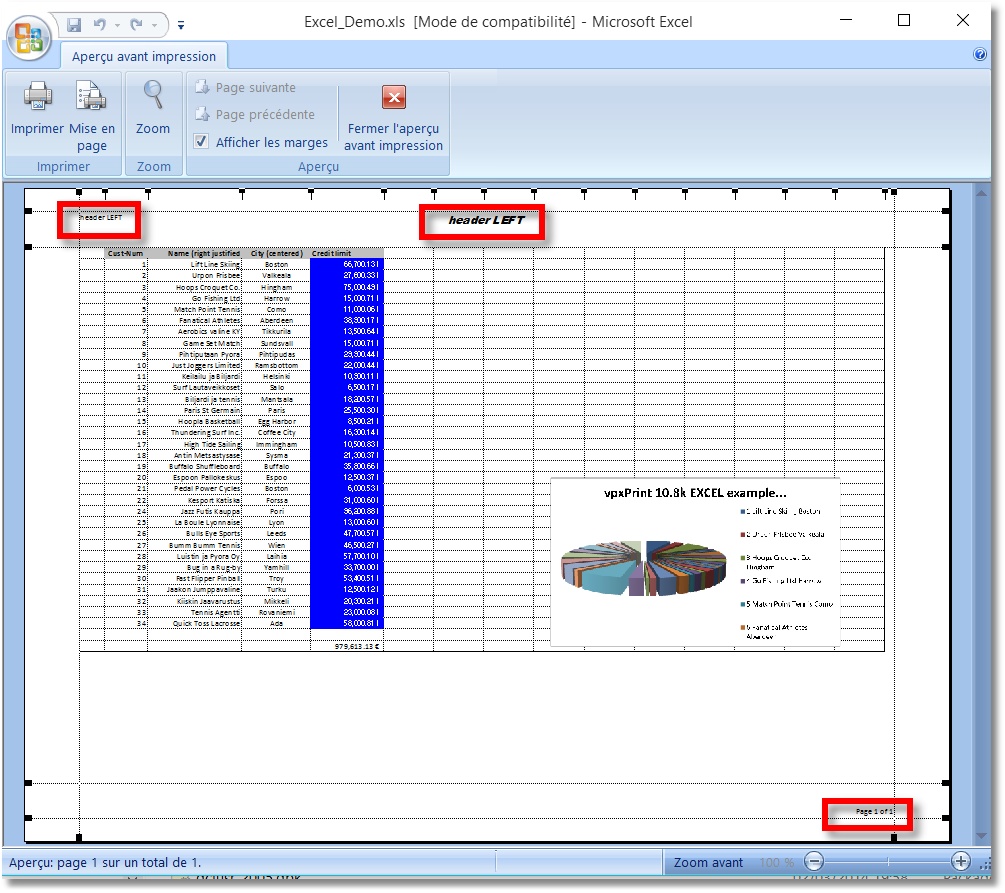
<XLS-LEFT-HEADER=header LEFT> |
values for printing |
<XLS-CENTER-HEADER=&"Arial Black,Italique"&14header LEFT> |
values for printing |
<XLS-right-footer=Page &P of &N> |
values for printing |
Excel preview: